What makes a subgroup interesting? Binary targets
A binary target asks whether a row has a selected label. The definition of interestingness determines whether the search favors a few extreme rows or a larger pattern with a more moderate effect. Supervised descriptive rule mining offers many related measures Kralj Novak et al., 2009Lavrač et al., 2004.
Counts first
Let be the dataset size, the number of positives, the subgroup size, and its positives. Write and .
| Statistic | Definition | Question |
|---|---|---|
| Relative size / coverage | What fraction of all rows belongs? | |
| Target share | How common is the positive label within the subgroup? | |
| Support | What fraction of all rows is both covered and positive? | |
| Recall | What fraction of positives is covered? | |
| Lift | How many times the dataset rate is the subgroup rate? | |
| WRAcc / leverage | How much excess positive mass is covered? |
“Support” has different uses across pattern-mining communities. State whether you mean subgroup size or positive joint support when reporting an analysis.
StandardQF and the size exponent
The package’s standard family is
At , only the rate difference matters. At , the score is WRAcc.
Intermediate exponents balance the two more gently. SimpleBinomialQF() is
StandardQF(0.5); it is a ranking measure, not a post-search significance test.
We can reproduce the candidates from the introduction before performing a search. Here the counts are hypothetical candidate summaries.
import numpy as np
import pandas as pd
import matplotlib.pyplot as plt
import pysubgroup as sd

candidates = pd.DataFrame({"size": [5, 30, 60], "positives": [5, 15, 18]}, index=["A", "B", "C"])
candidates["share"] = candidates.positives / candidates["size"]
for a in [0, 0.5, 1]:
    candidates[f"a={a}"] = (candidates["size"] / 100) ** a * (candidates.share - 0.2)
candidatesfig, ax = plt.subplots(figsize=(6, 4))
exponents = np.linspace(0, 1, 101)
for name, row in candidates.iterrows():
scores = (row["size"] / 100) ** exponents * (row["share"] - 0.2)
ax.plot(exponents, scores, label=name)
ax.set(xlabel="Size exponent a", ylabel="Quality", title="The preferred subgroup can change")
ax.legend()
plt.show()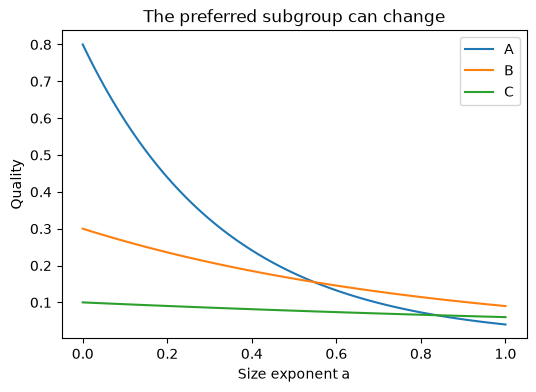
The curves cross because the candidates trade size for deviation. This is a substantive modeling choice, not just a tuning parameter for faster execution.
Evaluate a concrete description
from sklearn.datasets import load_iris

X, y = load_iris(return_X_y=True, as_frame=True)
data = X.assign(species=y)
target = sd.BinaryTarget().fit(data, "species", 2)
rule = sd.Rule((sd.Condition("petal length (cm)", "gt", 5),))
mask = sd.utils.subgroup_masks([rule], data)[0]
print("WRAcc:", sd.WRAccQF().evaluate(mask, target))
sd.to_dataframe([rule], data, target, statistics="all",
                measures={"WRAcc": sd.WRAccQF(), "share_difference": sd.LiftQF()})
WRAcc: 0.18
Despite its name, LiftQF() returns the target-share difference,
StandardQF(0), rather than the ratio . For a fixed dataset with ,
the two give the same ordering. The lift statistic in a result table is the
ratio. This distinction matters when reporting numerical values.
Search direction
direction="positive"rewards a rate above the dataset rate.direction="negative"rewards a rate below it.direction="both"rewards the absolute rate difference.
pd.Series({direction: sd.WRAccQF(direction=direction).evaluate(mask, target)
           for direction in ["positive", "negative", "both"]})
positive 0.18
negative -0.18
both 0.18
dtype: float64Scores in the opposite direction can be negative. With min_quality=0, they
will not be returned. For an empty subgroup, these standard measures return
nan; there is no meaningful within-group rate.
Choosing a measure
Start with WRAcc when both reach and enrichment matter. Use a smaller exponent when a small, strongly enriched group is valuable, and enforce a minimum size appropriate to the application. Inspect the subgroup counts whatever the score.
ChiSquaredQF() scores a binary subgroup-versus-complement contingency table.
Its test statistic rewards evidence of association and is unbounded in the
search API. stat="p" returns a p-value, which is smaller for stronger
evidence; the search always maximizes, so do not use raw p-values as if larger
meant more interesting. A test score computed on the discovery data also does
not adjust for searching many candidate descriptions.
Experiment. Search Iris with exponents 0, 0.5, and 1, holding the search space and minimum size fixed. Explain changes using both size and target share, rather than comparing quality numbers across differently defined measures.
- Kralj Novak, P., Lavrač, N., & Webb, G. I. (2009). Supervised Descriptive Rule Discovery: A Unifying Survey of Contrast Set, Emerging Pattern and Subgroup Mining. Journal of Machine Learning Research, 10, 377–403. https://jmlr.org/papers/v10/kralj-novak09a.html
- Lavrač, N., Kavšek, B., Flach, P., & Todorovski, L. (2004). Subgroup Discovery with CN2-SD. Journal of Machine Learning Research, 5, 153–188. https://jmlr.org/papers/v5/lavrac04a.html