An exploratory analysis from question to report
This chapter connects the pieces into an exploratory workflow on the Adult
census-income dataset. We ask which descriptively simple groups have a higher
share of the >50K income label? Then we change the question to working hours.
The examples describe associations in this historical dataset, not current
population estimates or effects of changing an individual’s attributes.
Load data and state the scope
Adult is fetched from OpenML on first use and cached under user_guide/data-cache/
when run from the book folder. This workflow reuses the introductory chapter’s
data cache and the same sample and descriptor selection. The model-audit
workflow uses an offline scikit-learn loader.
from pathlib import Path
from sklearn.datasets import fetch_openml
import pandas as pd
import matplotlib.pyplot as plt
import pysubgroup as sd
from pysubgroup import visualization as viz

adult = fetch_openml("adult", version=2, as_frame=True, data_home=Path("data-cache"))
columns = ["age", "workclass", "education", "marital-status", "occupation", "sex", "hours-per-week", "class"]
data = adult.frame[columns].sample(n=3000, random_state=42).copy()
features = data.drop(columns="class")
print("Analysis rows:", len(data))
data.head()
Analysis rows: 3000
The deterministic sample keeps this book example small. The source dataset has
a census sampling-weight column, fnlwgt; it is not a property that should
define a subgroup and is excluded. The measures used here count rows equally,
so the analysis is of these sampled records, not a survey-weighted inference.
Select descriptors deliberately. For example, education and education-num
encode closely related information; we retain only the former. Keep missing
descriptor values so that explicit missingness conditions can be considered.
Formulate the first task
target = sd.BinaryTarget().fit(data, "class", ">50K")
conditions = sd.generate_conditions(features, n_bins=4, numeric_candidates="thresholds")
task = sd.SubgroupDiscoveryTask(data, target, conditions, sd.WRAccQF(),
    result_set_size=30, depth=2, min_quality=0,
    filters=[sd.MinSizeFilter(100)])
candidates = sd.OPUS().execute(task)
sd.to_dataframe(candidates[:8], data, target,
["size", "relative_size", "target_share", "target_share_complement", "lift"])Two conditions keep descriptions short; one hundred rows avoids a list dominated by tiny groups; WRAcc values enrichment supported by substantial coverage. These choices define the exploratory question and should be recorded with the results.
Inspect redundancy before reporting
selected = sd.overlap_filter(candidates, data, max_similarity=0.6)[:5]
report = sd.to_dataframe(selected, data, target,
    ["size", "relative_size", "positives", "target_share", "target_share_complement", "lift"])
reportviz.plot_subgroup_bars(selected, data, target)
plt.show()
viz.plot_similarity(selected, data)
plt.show()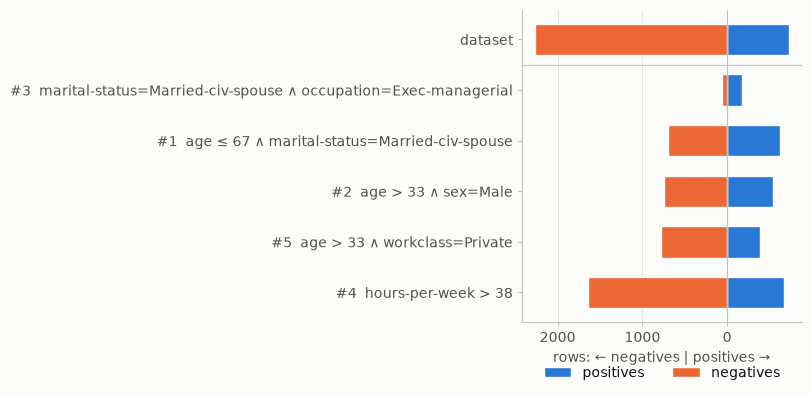
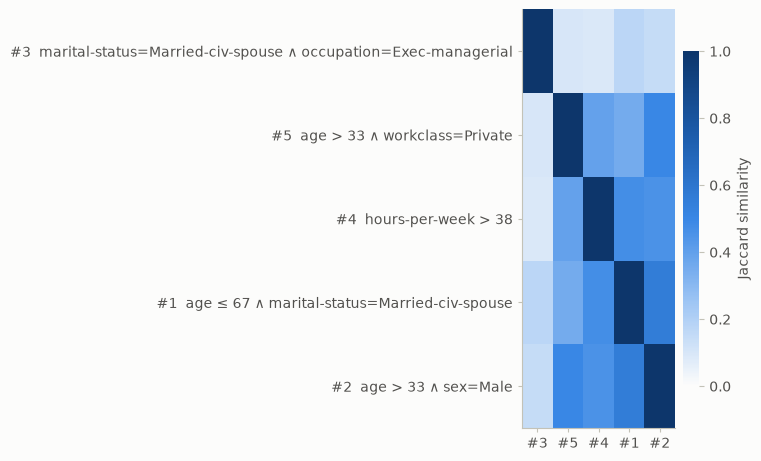
Low pairwise overlap does not mean independent findings. The descriptions can still reflect related social and economic structure. Read the actual members and consider whether categories are broad, ambiguous, or proxies for omitted variables.
A compact, reproducible finding
quality, rule = selected[0]
members = sd.subgroup_data(rule, data)
population_share = target.n_positives_ / len(data)
subgroup_share = (members["class"] == ">50K").mean()
print(f"Description: {rule}")
print(f"Rows: {len(members)} of {len(data)}")
print(f">50K share: {subgroup_share:.1%}; dataset: {population_share:.1%}")
print(f"Increase: {100 * (subgroup_share - population_share):.1f} percentage points")
print(f"Discovery WRAcc: {quality:.4f}; status: exploratory, not holdout-validated")
Description: [age ≤ 67 ∧ marital-status=Married-civ-spouse]
Rows: 1323 of 3000
>50K share: 47.1%; dataset: 24.3%
Increase: 22.8 percentage points
Discovery WRAcc: 0.1005; status: exploratory, not holdout-validated
This statement separates description, scope, effect, and score. It reports percentage points rather than calling a rate difference a percent increase. Keep all selected descriptions available alongside the summary so that the analyst’s selection is visible.
Change the question, then rerun the search
Suppose the interest is now unusually long working weeks. Working hours becomes the target and must leave the descriptor space. We also keep the income label out to focus on the remaining demographic/work categories.
numeric_features = data.drop(columns=["class", "hours-per-week"])
numeric_target = sd.NumericTarget().fit(data, "hours-per-week")
numeric_conditions = sd.generate_conditions(numeric_features, n_bins=4,
                                             numeric_candidates="thresholds")
numeric_task = sd.SubgroupDiscoveryTask(data, numeric_target, numeric_conditions,
    sd.StandardQFNumeric(0.5, estimator="combined"),
    result_set_size=10, depth=2, min_quality=0, filters=[sd.MinSizeFilter(100)])
numeric_results = sd.DFS().execute(numeric_task)
numeric_selected = sd.overlap_filter(numeric_results, data, max_similarity=0.6)[:4]
sd.to_dataframe(numeric_selected, data, numeric_target,
["size", "mean", "median", "mean_complement", "mean_difference"])viz.plot_target_distributions(numeric_selected, data, numeric_target)
plt.show()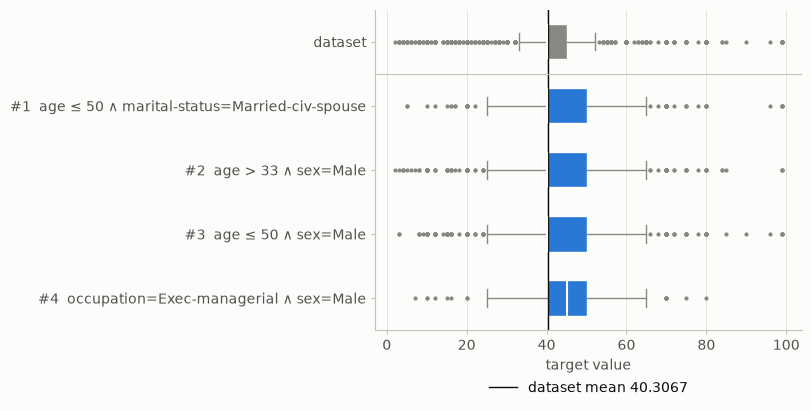
The resulting descriptions answer a new question. It would be misleading to reuse the income-ranked list and call it the best working-hours list merely because working hours can be computed for those same groups.
From exploration to a subsequent study
The workflow can suggest hypotheses and reveal data-quality issues. For a confirmatory analysis, reserve validation rows before selecting descriptions or cuts, and predefine how the resulting candidates will be tested. A new question suggested by this exploratory analysis is a reason for a new validation plan, not a reason to reinterpret these discovery scores as confirmation.
Experiment. Replace WRAcc with StandardQF(0.5), keeping the sample,
conditions, constraints, and overlap filter fixed. Write a short comparison
that explains which groups became smaller, more enriched, or less redundant.