Exceptional Model Mining
A subgroup can be exceptional even when its target means are ordinary. Perhaps two measurements are positively related in most rows but negatively related in one describable population. Exceptional Model Mining (EMM) searches for such differences in fitted models Leman et al., 2008Duivesteijn et al., 2016.
A controlled relationship example
We construct 240 rows with a known segment-dependent relationship. Synthetic data makes the intended effect explicit; real applications require interpreting how the measurements were collected and what the model assumes.
import numpy as np
import pandas as pd
import matplotlib.pyplot as plt
import pysubgroup as sd
from pysubgroup import visualization as viz

rng = np.random.default_rng(7)
n = 240
segment = np.repeat(["A", "B", "C"], n // 3)
x = rng.normal(size=n)
z = rng.normal(size=n)
y = np.where(segment == "C", -1.5, 1.2) * x + 0.3 * z + rng.normal(0, 0.6, n)
data = pd.DataFrame({"segment": segment, "site": np.tile(["east", "west"], n // 2),
                     "x": x, "z": z, "y": y})
conditions = sd.generate_conditions(data[["segment", "site"]])
target = sd.CorrelationTarget().fit(data, "x", "y")
qf = sd.CorrelationDifferenceQF(reference="complement", entropy=True)
task = sd.SubgroupDiscoveryTask(data, target, conditions, qf,
                                result_set_size=4, depth=2,
                                filters=[sd.MinSizeFilter(30)])
results = sd.DFS().execute(task)
sd.to_dataframe(results, data, target)The subgroup and complement correlations describe two disjoint groups. Segment
C should stand out because its relationship was generated with the opposite
slope. Model attributes x and y never enter the description space.
viz.plot_model_scatter(results, data, target, jitter=0)
plt.show()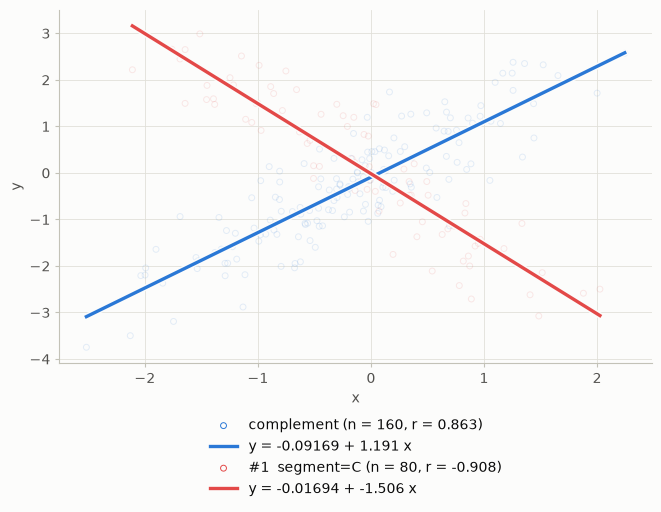
The lines and point clouds are more informative than the score alone. Look for
nonlinearity, unusual leverage points, or a narrow range of x within one group.
Choosing the reference and score
CorrelationDifferenceQF scores an absolute correlation difference; entropy=True
multiplies it by the entropy of the subgroup/complement split. This downweights
very unbalanced splits. reference="dataset" compares with the whole dataset;
"complement" compares with the rows outside the subgroup. These answer
different questions because the dataset includes the subgroup itself.
Test-based measures offer score="1-p" by default and score="statistic" as
an alternative. For strong effects, 1-p can round to exactly one, producing
many ties. The statistic often retains more numerical resolution. For the
slope measure, changing degrees of freedom means statistic and p-value rankings
need not agree. Neither score adjusts for the discovery search.
Regression and other model families
regression_target = sd.RegressionTarget().fit(data, "x", "y")
regression_task = sd.SubgroupDiscoveryTask(data, regression_target, conditions,
    sd.SlopeSignificanceQF(score="statistic"), result_set_size=4, depth=2,
    filters=[sd.MinSizeFilter(30)])
regression_results = sd.DFS().execute(regression_task)
sd.to_dataframe(regression_results, data, regression_target)This searches for different slopes, using a Welch-type test. The intercept and slope columns show the fitted relationships in subgroup and complement.
| Question | Target | Measure |
|---|---|---|
| Different correlation? | CorrelationTarget | CorrelationDifferenceQF or CorrelationSignificanceQF |
| Different simple-regression slope? | RegressionTarget | SlopeSignificanceQF |
| Different multiple-regression coefficients? | GeneralRegressionTarget | CooksDistanceQF |
| Different logistic-regression slope? | LogisticRegressionTarget | LogisticInteractionQF |
| Different association between categorical variables? | AssociationTarget | AssociationDevianceQF |
| Different categorical conditional distributions? | DecisionTableTarget | HellingerQF or BDeuQF |
| Different fitted likelihood-model parameters? | LikelihoodTarget | LikelihoodQF |
The next example executes one search per additional family on the same small description space. The generated categorical variables are model attributes, not extra descriptors.
data["label"] = rng.binomial(1, 1 / (1 + np.exp(-y)))
data["x_band"] = pd.cut(data.x, [-np.inf, 0, np.inf], labels=["low", "high"])
data["y_band"] = pd.cut(data.y, [-np.inf, 0, np.inf], labels=["low", "high"])
families = [
    (sd.GeneralRegressionTarget().fit(data, "x", "z", "y"), sd.CooksDistanceQF()),
    (sd.LogisticRegressionTarget().fit(data, "x", "label", 1),
     sd.LogisticInteractionQF(score="statistic")),
    (sd.AssociationTarget().fit(data, "x_band", "y_band"), sd.AssociationDevianceQF()),
    (sd.DecisionTableTarget().fit(data, "x_band", "y_band"), sd.HellingerQF(entropy=True)),
    (sd.DecisionTableTarget().fit(data, "x_band", "y_band"), sd.BDeuQF()),
]
summary = []
for model_target, measure in families:
    model_task = sd.SubgroupDiscoveryTask(data, model_target, conditions, measure,
        depth=2, result_set_size=2, filters=[sd.MinSizeFilter(30)])
    found = sd.DFS().execute(model_task)
    summary.append({"measure": type(measure).__name__, "best_rule": str(found[0][1]),
                    "quality": found[0][0]})
pd.DataFrame(summary)For multiple regression, response is the last fitted attribute. For decision
tables, output is last and preceding attributes identify the input cell.
BDeuQF is the log BDeu score on the subgroup, not a generic effect-size
difference; its scale and size behavior differ from Hellinger distance.
The logistic interaction measure uses a Wald test of the subgroup-by-predictor
interaction. Association deviance fits a homogeneous-association log-linear
model, so it can detect effects that marginal WKL misses.
Likelihood-based model comparison
likelihood_target = sd.LikelihoodTarget(sd.PolynomialRegressionModel(degree=2)).fit(data, "x", "y")
likelihood_task = sd.SubgroupDiscoveryTask(data, likelihood_target, conditions,
    sd.LikelihoodQF(statistic="ratio", score="statistic"),
    depth=2, result_set_size=3, filters=[sd.MinSizeFilter(30)])
likelihood_results = sd.DFS().execute(likelihood_task)
sd.to_dataframe(likelihood_results, data, likelihood_target)The likelihood-ratio statistic compares separate maximum-likelihood fits on subgroup and complement with a common dataset fit Wilks, 1938:
It detects parameter differences within the chosen model class, not arbitrary
poor model fit. A subgroup that is badly modeled in the same way under both fits
need not receive a large score. statistic="density" instead reproduces the
mean-density difference available in pysubgroup 0.x; it is scale-dependent and is
not the likelihood-ratio test. A custom likelihood model
can extend the available model classes.
Computation and undefined fits
Most model-based measures here have no implemented optimistic estimate. Minimum-size pruning remains available, and moment-based measures support batched evaluation. Logistic and likelihood-based measures fit models separately for each subgroup and can be more expensive.
Small groups, constant attributes, singular regressions, or failed logistic fits can make a model undefined. Such qualities are not reported. The minimum size is an analysis decision; the package does not automatically enforce all sample-size advice from the papers.
GP-growth aggregates valuation bases—sufficient summaries such as counts and cross-products—in its pattern trees Lemmerich et al., 2012:
gp_results = sd.GPGrowth().execute(regression_task)
print("DFS qualities:", [round(q, 6) for q, _ in regression_results])
print("GP-growth qualities:", [round(q, 6) for q, _ in gp_results])
DFS qualities: [28.022224, 14.657452, 14.323769, 10.330645]
GP-growth qualities: [28.022224, 14.657452, 14.323769, 10.330645]
With valuation="auto", it uses condensed statistics when possible and row
sets otherwise. It is an alternative exhaustive search, not a different EMM
quality function.
Experiment. Remove segment C and repeat the correlation search. Then add
an offset to y for segment C without changing its slope. Which measures should
detect the altered relationship, and which should remain approximately unchanged?
- Leman, D., Feelders, A., & Knobbe, A. (2008). Exceptional Model Mining. Machine Learning and Knowledge Discovery in Databases, 5212, 1–16.
- Duivesteijn, W., Feelders, A. J., & Knobbe, A. (2016). Exceptional Model Mining: Supervised Descriptive Local Pattern Mining with Complex Target Concepts. Data Mining and Knowledge Discovery, 30, 47–98.
- Wilks, S. S. (1938). The Large-Sample Distribution of the Likelihood Ratio for Testing Composite Hypotheses. The Annals of Mathematical Statistics, 9(1), 60–62. 10.1214/aoms/1177732360
- Lemmerich, F., Becker, M., & Atzmueller, M. (2012). Generic Pattern Trees for Exhaustive Exceptional Model Mining. Machine Learning and Knowledge Discovery in Databases.